How to read this platform
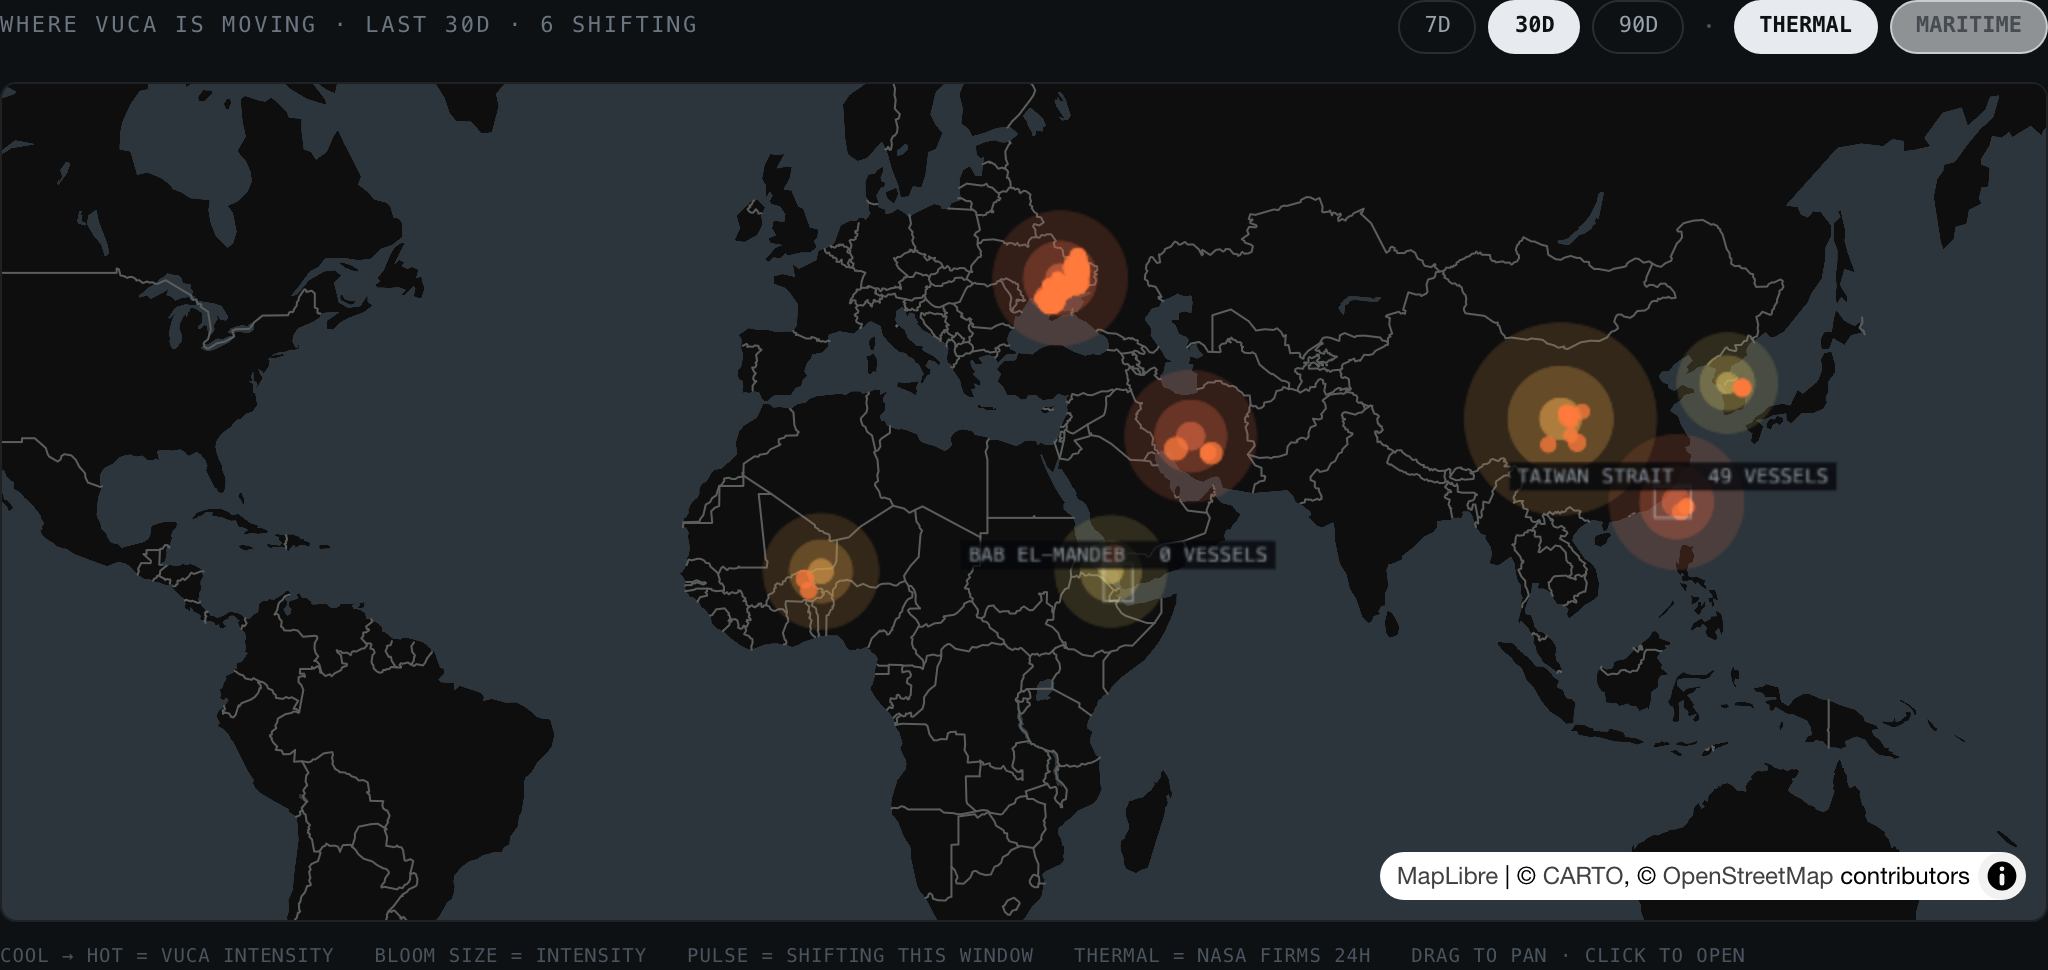
VUCA News doesn't track articles — it tracks Dynamics: persistent geopolitical situations that evolve over months or years. Everything on screen answers one of five questions: what changed, why, who is involved, what happens next, and how confident we are.
Each glowing bloom is one Dynamic. Color runs cool → hot with VUCA intensity, size scales with intensity, and a pulse means the situation shifted materially in the selected window (7D / 30D / 90D). Drag to pan, scroll to zoom, click a bloom to open its dossier. Two evidence layers can be toggled on: THERMAL shows actual satellite fire detections from the last 24 hours (NASA FIRMS), and MARITIME outlines the ship-traffic corridors we monitor, with today's vessel counts.
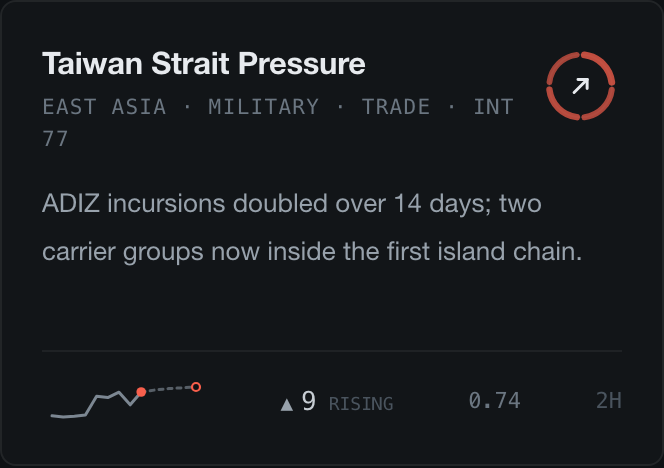
Every situation card carries the ring — the platform's signature glyph. Its four arcs are Volatility, Uncertainty, Complexity, and Ambiguity (clockwise from top); heavier, more opaque arcs mean higher component scores. Arc color encodes overall intensity, the center arrow shows trajectory (↗ rising · → steady · ↘ easing), and a faded ring means our confidence in the estimate is lower. Below the headline, the sparkline shows 90 days observed plus a dashed near-term forecast.
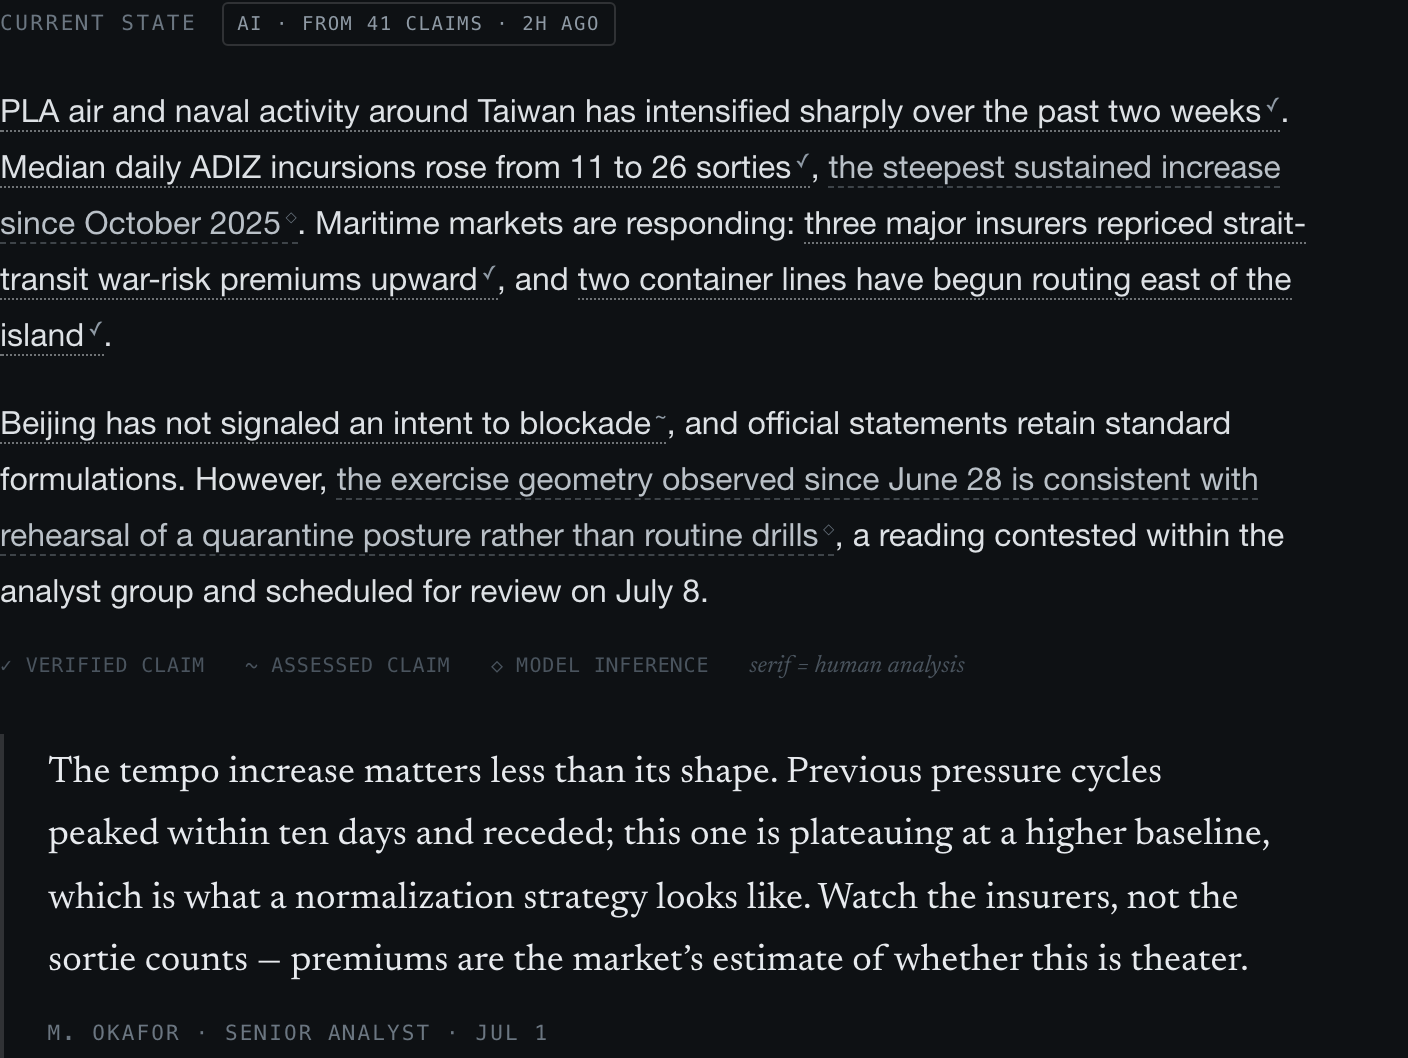
A dossier reads top to bottom in order of trust and depth: the 10-second header (index dial, trajectory, confidence) → what changed in the last 72 hours → intensity vs. its own 90-day baseline → the four VUCA components → the narrative → timeline → claims → forecasts → raw signal. Every sentence in the narrative is classed: dotted underline = an evidence-backed claim (click it), ✓ verified · ~ assessed, ◇ = model inference, and serif type is always a human analyst speaking.
Click any claim — in the narrative, the claims matrix, or search — and the evidence chain opens: every supporting item with its source tier (TIER 1 = primary/official, 2 = independent reporting or imagery, 3 = secondary), the provenance record of how the claim was produced, and its confidence revision history. The confidence number (0–1) reflects sourcing quality; claims marked ASSESSED are supported but not primary-source verified. Some claims carry SATELLITE THERMAL evidence — automatic corroboration from fire-detecting satellites near the claimed place and time.

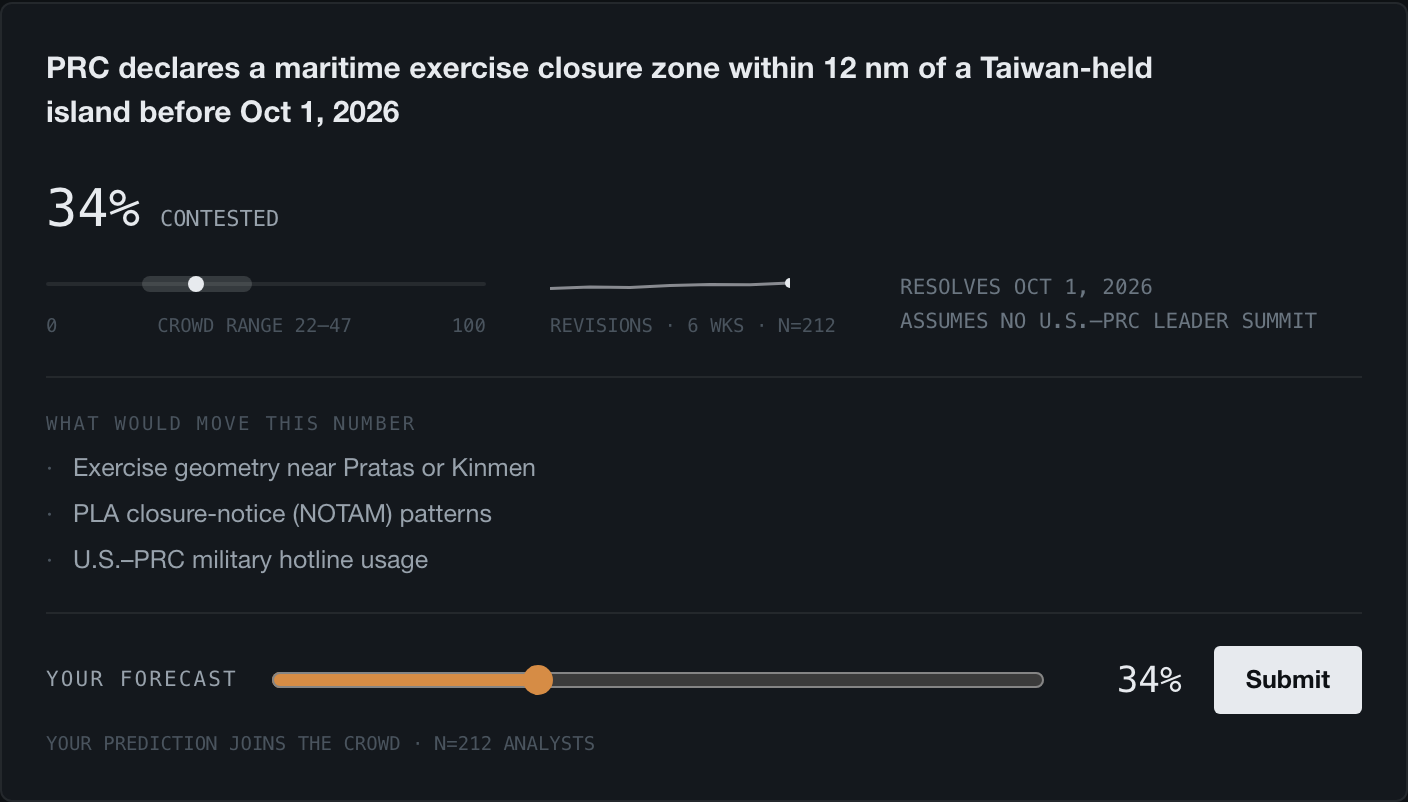
Forecast questions resolve against explicit criteria by a fixed date. The big number is the crowd's aggregate probability; the band is the crowd range; the small chart shows weekly revisions. “What would move this number” lists the leading indicators to watch — forecasts here explain themselves or they don't ship. Drag the slider to add your own forecast; your mark (in orange) joins the crowd.
Press ⌘K (or Ctrl K) anywhere to search situations, entities, and claims — claim results deep-link straight into their evidence drawer. Esc closes any panel. Entity pages (via search or any entity chip) show what an actor participates in, its relationships, and recent claims about it — everything connects, and nothing is a dead end.
Ingestion pulls from registered sources (UN OCHA ReliefWeb, official feeds, monitored outlets, GDELT, USGS seismic, ship-traffic telemetry) around the clock. Claims are machine-extracted with a grounding quote, adversarially reviewed by AI, and always approved by a human editor before publication. VUCA scores are computed daily by a transparent formula over these signals — every score can explain itself, down to the feature values that produced it.